International Journal of Pharmaceutical Sciences and Developmental Research
Model Independent and Dependent Methods for Dissolution Profiles Comparison: Can we take the Road Less Travelled?
Adithya Karthik Bhattiprolu, Sivacharan Kollipara, Rajkumar Boddu, Arvind Rachapally and Tausif Ahmed*
ORCiD : Sivacharan Kollipara - https://orcid.org/0000-0002-7332-9021
ORCiD : Rajkumar Boddu - https://orcid.org/0000-0002-8666-3643
ORCiD : Arvind Rachapally - https://orcid.org/0009-0002-0494-9857
ORCiD : *Tausif Ahmed - https://orcid.org/0000-0001-6866-6691
Cite this as
Bhattiprolu AK, Kollipara S, Boddu R, Rachapally A, Ahmed T. Model Independent and Dependent Methods for Dissolution Profiles Comparison: Can we take the Road Less Travelled?. Int J Pharm Sci Dev Res. 2024; 10(1):022-029. DOI: 10.17352/ijpsdr.000053Copyright License
© 2024 Bhattiprolu AK, et al. This is an open-access article distributed under the terms of the Creative Commons Attribution License, which permits unrestricted use, distribution, and reproduction in any medium, provided the original author and source are credited.Dissolution testing plays an important role in pharmaceutical development due to its ability to provide critical insight into in vivo performance. Dissolution testing during routine pharmaceutical development can ensure batch-to-batch consistency and helps to ensure that the commercial batches are of representative quality to that of studied in the pivotal clinical studies. For comparing the dissolution profiles, there are multitude of approaches suggested by various regulatory agencies that consist of model independent and dependent approaches. The present review aims to summarize the current understanding of dissolution profile similarity approaches. Dissolution profile comparison approaches suggested by various regulatory agencies were compared and contrasted. Further, detailed procedural aspects were provided for the determination of similarity using model independent and dependent approaches. Model independent approaches such as f2 bootstrap, and Multivariate Statistical Distance (MSD) were portrayed from a practical perspective. Advanced tools such as Bias-Corrected and accelerated (BCa) for f2 bootstrap were discussed in depth. Further, model dependent approaches such as zero order, and Weibull models were discussed from realistic scenarios. Finally, the utility of modeling and simulation approaches such as physiologically based pharmacokinetics model (PBPK) and physiologically based biopharmaceutics model (PBBM) were discussed in the context of their ability and potential to supersede traditional dissolution dissimilarity. Overall, this article acts as a ready-to-use guide for pharmaceutics and biopharmaceutics scientists for effective methodologies for dissolution profile comparison for internal decision-making and regulatory justifications.
Introduction
Dissolution is a process where the solute in a gaseous, liquid, or solid phase dissolves in a solvent to form a solution [1]. Solubility is the maximum concentration at which a solute can be dissolved in a solvent whereas dissolution is the rate at which a solute can dissolve in a solvent. Thus, solubility is a thermodynamic phenomenon whereas dissolution is a rate phenomenon. In the case of pharmaceutical testing, dissolution is evident for any type of dosage form except solutions. After oral administration, for an Active Pharmaceutical Ingredient (API) to exert its pharmacological effect, dissolution is necessary. After ingestion, the dosage form (e.g. tablet or capsule) gets disintegrated first followed by dissolution, and only the dissolved portion of API gets permeated and reaches systemic circulation. In the case of Immediate Release (IR) dosage forms, the API is available for dissolution immediately after disintegration whereas in the case of Modified Release (MR) dosage forms, the release of API is slower due to the presence of a rate controlling mechanism [2,3]. Because of the fact that only the dissolved drug can exert its intended effect, dissolution testing is typically considered as an in vitro test that can provide significant insight into in vivo performance and thus ensures the clinical quality of dosage form.
From the other side of the coin, dissolution testing is considered to be a Critical Quality Attribute (CQA) of a dosage form that can ensure batch-to-batch consistency, reproducibility of the manufacturing process, and stability of the dosage form and thus can impart pharmaceutical quality into the drug product life cycle [4,5]. A product that yields a consistent dissolution profile that meets pre-defined specification criteria is desirable from a manufacturing perspective. A drug product that results in meeting specification criteria during stability testing is desirable from a quality perspective. Thus, dissolution profile testing as a routine analysis tool ensures that the drug product is meeting pharmaceutical quality and thus can ensure optimum performance. Thus, from both clinical as well as quality perspectives, dissolution testing is considered to be an important test during research and development as well as in a commercial setting.
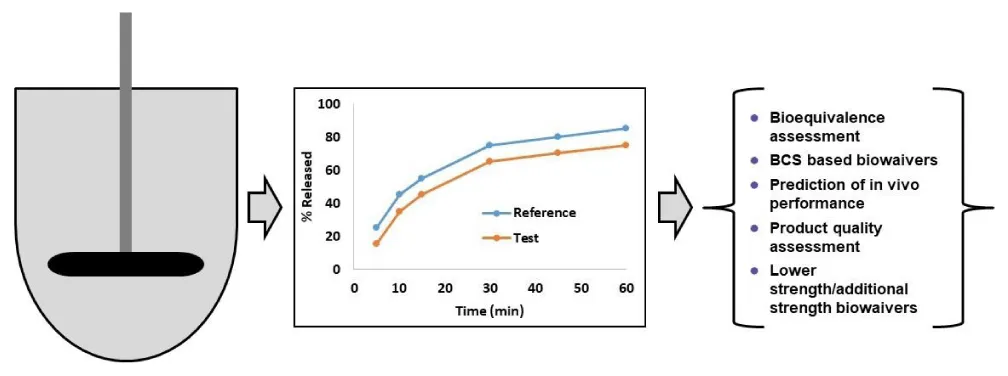
Because of its significance, dissolution and its similarity testing during pharmaceutical development have many applications as indicated in Figure 1. Dissolution similarity testing between reference and test products during the generic product development can ensure their equivalence in vitro and possible similar therapeutic impact. Dissolution similarity testing is also used for Biopharmaceutics Classification System (BCS) based biowaivers for BCS class I API containing drug products [6,7]. Dissolution similarity testing of pre- and post-change batches during site transfers, composition changes, and manufacturing process changes ensures that the drug product quality is not compromised. Dissolution similarity testing between higher and lower strengths ensures that the lower strengths or additional strengths qualify for the biowaivers and thus can avoid unnecessary human studies. Additionally, dissolution testing is also used to establish in vitro-in vivo Correlation (IVIVC) and thus can avoid potential human clinical study [8,9]. Thus, dissolution similarity testing is pivotal in pharmaceutical development and is routinely used during the drug product life cycle at all stages. Considering this plethora of applications of dissolution and its similarity testing, various regulatory agencies such as the USFDA, and EMA have come up with regulatory guidance documents detailing the cases in which dissolution testing is required (Table 1).
For comparison of dissolution profiles of two different formulations, there are a multitude of approaches suggested in the regulatory guidance documents as well in the literature. However, the most common approach that is used is the dissolution similarity factor or f2. This approach is called the model independent approach and typically involves the calculation of the mean difference between dissolution profiles at every time point. However, there are few specific requirements that have been defined for the implementation of f2 such as variability in the dissolution, number of time points, etc. In case of high variability in the dissolution, alternative approaches have been suggested by the agency. These approaches are broadly defined as model dependent and model independent approaches and offer various opportunities and possibilities for using these comparison techniques. Although such alternative approaches are defined in regulatory guidance documents, their usage is very limited probably due to their complexity, lesser regulatory experience, and requirement of specialized software tools. However, understanding these challenges may help to use alternative approaches for regulatory submissions and thus can enhance the probability of dissolution similarity.
In this context, the present article aims to clarify the model independent and model dependent approaches for the comparison of dissolution profiles. Firstly, an overview of model dependent and independent approaches suggested by various regulatory agencies is described. Further, model independent approaches such as f2 (conventional and its bootstrap), and Multivariate Statistical Distance (MSD) are described. Model dependent approaches such as Weibull, zero order, and first-order are described with appropriate literature. Finally, the utility of physiological modeling and simulation approaches such as physiologically based pharmacokinetic model (PBPK) and physiologically based biopharmaceutics model (PBBM) models to justify the absence of in vivo impact due to dissolution dissimilarity are described [20-23]. Overall, this article acts as a ready-to-use guide for pharmaceutical and biopharmaceutics scientists to choose and use appropriate approaches for dissolution profile similarity determinations.
Dissolution profile comparison methods
Almost all the regulatory agencies suggested the use of model dependent and model independent approaches as described in Table 1. In terms of model independent approaches, almost all the regulatory agencies suggested dissolution similarity factor f2, and limits are defined as 50 to 100 for successful similarity assessment. Further, the dissolution dissimilarity factor (f1) was also suggested by a few regulatory agencies such as the USFDA and EMA with a limit of 0-15 for successful similarity assessment [10,12]. Most of the regulatory agencies recommend the use of alternative statistical methodologies in case of high variability in the dissolution profiles however, approaches such as f2 bootstrap were not specifically described in regulatory guidance documents. EMA specifies the advantage of f2 bootstrap over the MSD approach in a separate scientific document [24]. However, most of the other agencies specify the use of a multivariate statistical distance approach as an alternative statistical methodology in case of high variability in the dissolution profiles. Most of the agencies specify a similarity limit of 10% while performing the similarity calculations with the MSD approach. Unlike model independent approaches, most regulatory agencies did not specify in detail about model dependent approaches. As the name indicates, model dependent methods require the dissolution data to be fitted into a specific dissolution model. Typically, the goodness-of-fit of a specific is described through regression coefficient (R2) and Mean Squared Error (MSE). The higher the R2 and lower the MSE, good is the fit of dissolution data into a specific model. Once a specific model is selected for dissolution data, further analysis can be performed for dissolution profile comparison. USFDA described in detail the model dependent approaches and also specified examples of models that can be used to fit the dissolution profiles [10]. EMA and ASEAN guidance documents mention the Weibull function as an example of model dependent approaches and also recommend the use of an alternative approach if properly justified [12,16]. Overall, it can be seen from Table 1 that there is a good amount of consensus among various regulatory agencies with respect to model independent and dependent approaches and these approaches are further defined in a simplified manner in the subsequent sections.
Model independent methods: As described previously, approaches such as f2, f2 bootstrap, and MSD approaches are the most used in dissolution profile comparison under the umbrella of model independent methods. The f2 factor is most used in the dissolution profiles comparison and a comparison of f2 determination among various regulatory agencies is provided in Table 2. In general, all the guidelines mention the requirement of 12 units for comparing the dissolution profiles. In cases where very rapid dissolution is achieved (i.e. >85% in 15 min), dissolution profiles are considered to be similar without the requirement of similarity calculations. Most of the guidance mentions that the time points can be considered until either of the products are releasing 85%, whereas USFDA mentions that time points when both products are releasing up to 85% can be considered [10]. However, when the release is more than 85%, only a one-time point can be considered. The time points criteria are not explicitly mentioned by the guidance, USFDA provides examples of time points such as 5, 10, 15, 20, and 30 minutes, EMA suggests a minimum of three time points and ANVISA mentions clearly about time points criteria such as 40% time points are called earlier points, only one point after 85%, etc. Overall, there is a good amount of consensus exists between various regulatory agencies for the f2 calculation [18].
The formula for f2 calculation is presented below in equation (1) [25]. It basically calculates the absolute mean difference between two different dissolution profiles.
Where p is the number of time points and X ̅Ti and X ̅Ri are mean dissolution data at the ith time point of reference and test formulations respectively
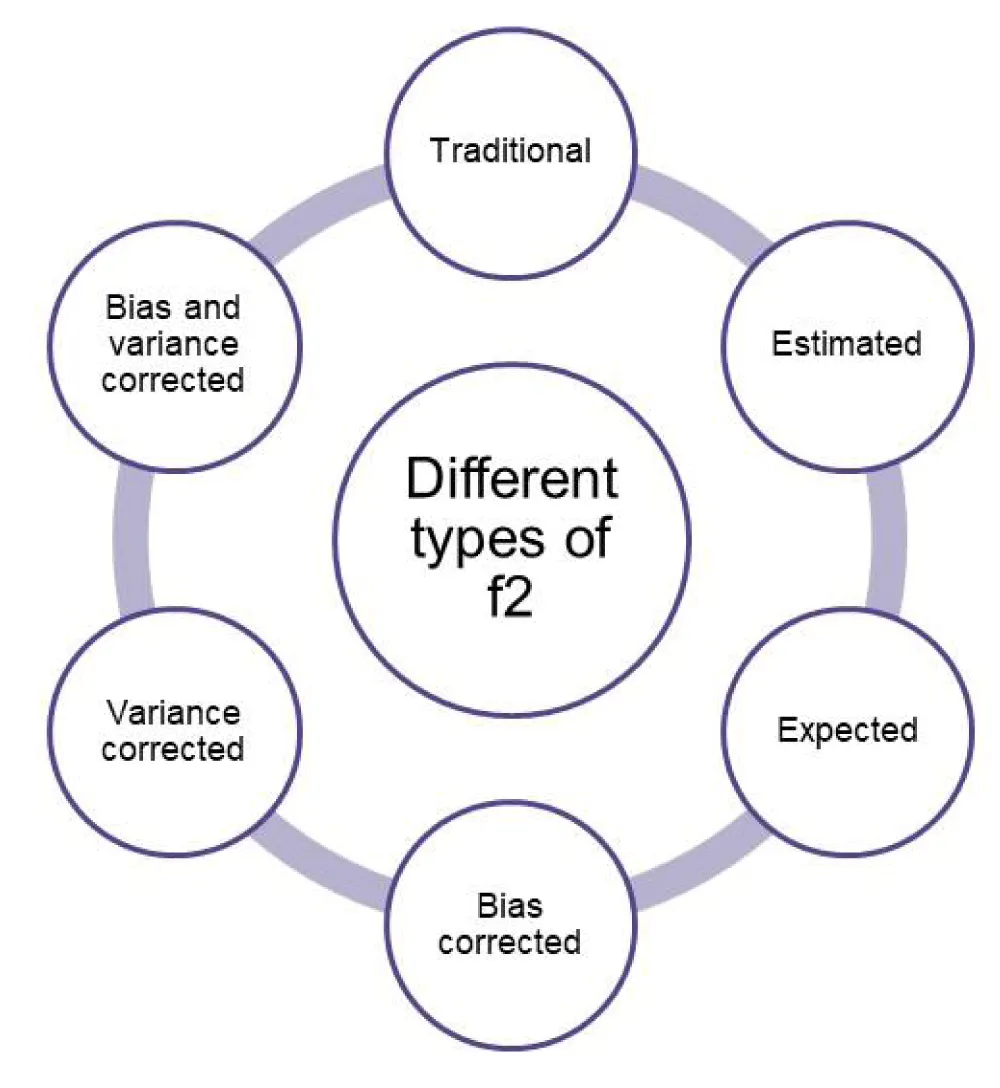
This f2 is typically called an estimated f2 and is used in regulatory submissions and calculations. However, there are different types of f2 as indicated in Figure 2, and are used in order to provide a more accurate estimation of f2. These are namely: bias-corrected f2, expected f2, variance-corrected f2, and bias and variance-corrected f2 [26]. Although these types of f2 are typically not listed in regulatory documents, they help to account for bias and potential corrections in the calculations. Regulatory agencies such as EMA now prefer expected f2 over other types of f2 as it represents more stringent criteria as compared to others.
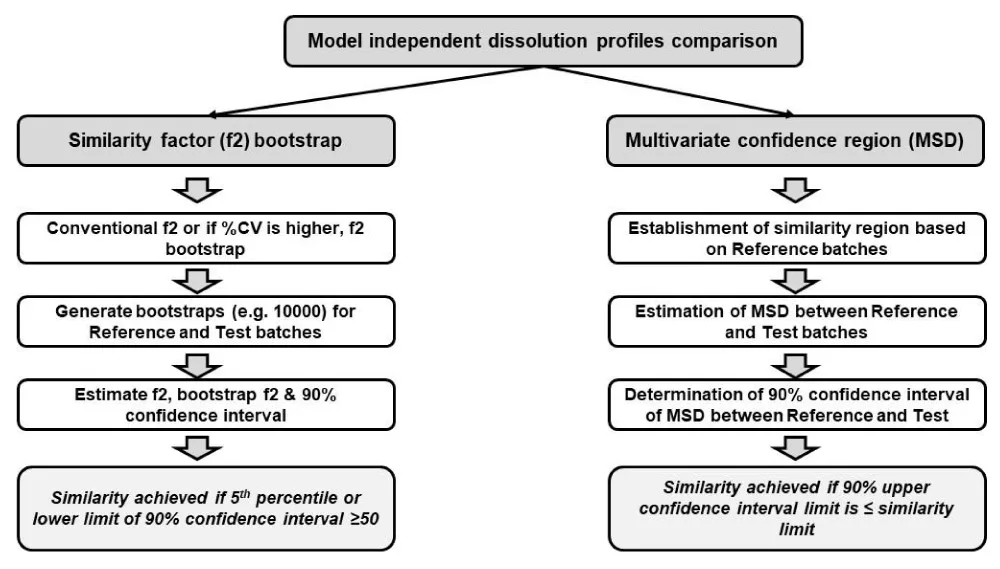
Another factor to consider while performing dissolution profile similarity is the variability in the dissolution. In the case of highly variable dissolution profiles (i.e. %CV higher than 20% at initial time points or higher than 10% at later time points), conventional f2 calculation may not be relevant. In those cases, alternative statistical approaches such as f2 bootstrap and Multivariate Statistical Distance (MSD) approaches can be effectively utilized. The procedural aspects of both of these approaches are represented in Figure 3. In the case of the f2 bootstrap approach, a number of bootstraps (e.g. 5000 or 10000) are generated for both reference and test batches using n=12 units. Based on this bootstrap data, mean, and median f2 are calculated together with 90% Confidence Intervals (CI). Dissolution similarity is deemed to be achieved if the lower limit of 90% CI is ≥50. The CI estimated using this approach is called percentile limits which typically yields potential skewness in the distribution of computed f2 values. In order to correct this aspect, another approach namely and accelerated approach (BCa) can be used. This BCa interval requires the estimation of two parameters namely bias correction parameter (Z0) and acceleration parameter (a) [27]. due to this potential correction in the skewness of distribution as well as bias, it can yield accurate estimation of confidence intervals and higher chances and probability of achieving similarity as compared to conventional percentile methods. This aspect is nicely discussed and summarized by Boddu, et al. wherein both conventional and BCa f2 approaches are compared with datasets containing different variabilities and the impact of sample size and number of bootstraps were studied [28]. It was concluded that the number of bootstraps did not impact the results but the number of samples increased the probability of acceptance. This publication also talked about different software tools that can be used for this evaluation namely DDSolver, R-software, SAS, JMP, and PhEq. Tools such as R-software and JMP can enable the calculation of confidence intervals using the BCa approach.
Another attractive approach that is used for similarity calculations in the case of highly variable dissolution profiles is the MSD approach. Kollipara, et al. described a step-by-step procedure for similarity calculations using this approach which is also presented in Figure 3 [29]. In this approach, initially, the similarity region is calculated based on the standard, approved, or reference products. As the next step, MSD is calculated between reference and test batches, and further, 90% CI is determined for the calculated MSD approach. Finally, similarity is deemed to be achieved if the 90% upper CI of MSD is less than or equal to the similarity limit calculated from standard approved batches. Since this approach involves the determination of similarity limit based on standard approved batches, this calculation represents that the difference between test and reference batches should be less than that of the variability of the reference batches in order to conclude similarity. Apart from f2 bootstrap and MSD approaches, other model independent approaches such as Wellek’s T-square also have been recommended (T2EQ, T^2 test for equivalence) in the literature [30].
Model dependent methods: Apart from model independent approaches, regulatory agencies such as the USFDA recommend the use of model dependent approaches [10]. As the name suggests, model dependent approaches include fitting the dissolution data into specific models and then evaluating the similarity between two different dissolution profiles. In order to handle highly variable dissolution profiles (%CV at initial time points >20% and at later time points >10%), apart from model independent approaches, agencies also recommended model dependent approaches.
Such model dependent approaches typically include fitting the dissolution data into mathematical models such as zero order, first order, Weibull, logistic, and probit equations. These models include model parameters that can range from 1 to >2 and as the number of coefficients gets increased, the complexity of the similarity analysis also increases.
Kollipara, et al. described the dissolution similarity approaches for highly variable dissolution profiles using model dependent approaches with zero order (1 parameter) and Weibull (2 parameters) equations [29]. As a first step, the dissolution data is to be fitted into different types of models in order to understand the model that describes the data well. For example, the dissolution data can be fitted into zero order, first order, Weibull equation, and depending on the least squares criteria as well as regression coefficient, a specific model is selected. Further, the similarity region of model parameters (e.g. zero order rate constant, Weibull shape, and scale factors) is established with reference or standard batches. Later, the MSD between model parameters for reference and test batches is determined followed by the determination of a 90% confidence region of true difference between batches. Similarity is deemed to be achieved if the determined confidence region is within the similarity region.
In the case of the zero-order dissolution model, there is only one model parameter, i.e. zero order release rate constant. In such cases, the highest MSD is determined by comparing reference or standard approved batches. Further, the 90% confidence interval is dextermined between reference and test products and similarity is achieved if the upper 90% CI of test vs reference is less than the MSD value. In contrast, because of the presence of two parameters (e.g. Weibull: shape and scale), the similarity region is typically a 2-dimensional region that is determined based on reference products. Further, 90% CI limits for both parameters are determined and a confidence region is calculated by comparing reference and test products. Again, similarity is achieved if the 90% confidence region is within the similarity region. Overall, this model dependent approach is of attractive choice wherein the dissolution data can be fitted into the appropriate model to determine the mechanism of release as well as to conclude dissolution similarity.
PBBM or PBPK modeling to supersede dissolution dissimilarity
In recent times, approaches such as physiologically based pharmacokinetic model (PBPK) and physiologically based biopharmaceutics models (PBBM) have gained prominence due to their ability to simulate in vivo conditions accurately [31,32]. Such models take into consideration of various aspects namely API, formulation, physiological, and pharmacokinetic properties and simulate the in vivo behavior of different types of dosage forms under fasting and fed conditions. These models have demonstrated a plethora of applications for both new drugs as well as generic product development such as prediction of first in human pharmacokinetics, drug-drug interactions at both absorption and systemic levels, biowaivers, dissolution safe space estimation, establishment of clinically relevant dissolution specifications and dissolution safe space estimation etc [33-36]. Because of their ability to circumvent and avoid potential human studies, these models have gained tremendous significance in recent times with respect to their usage for internal decision-making and regulatory applications.
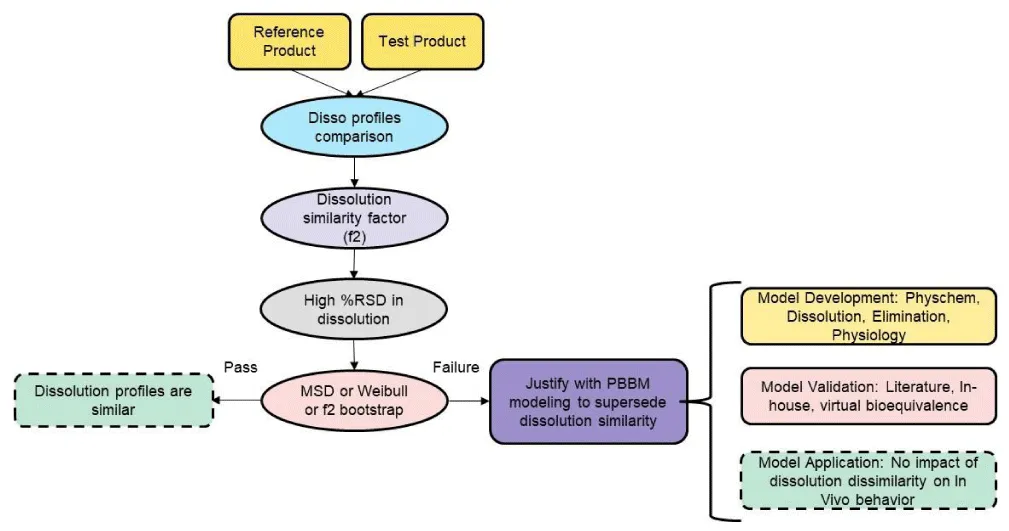
One of the critical inputs into such models is the dissolution as it is a critical factor that can govern in vivo performance. A pre-requisite for dissolution data input is that the dissolution data needs to be bio-predictive meaning it should have been validated against in vivo plasma concentration data. Recent reviews indicated that there has been significant progress achieved in the identification of biopredictive media that can predict in vivo performance with the help of PBBM and PBPK models [37]. When dissolution data is inputted into such models, they have the ability to determine the role and context of in vitro dissolution on in vivo performance. In this context, approaches such as PBBM and PBPK models coupled with in vitro dissolution can be used to supersede the dissolution dissimilarity through the demonstration of the absence of in vivo impact. The approach of utilizing these models for superseding dissolution dissimilarity is provided in Figure 4. Initially, dissolution similarity can be evaluated using model dependent and independent approaches as described above. In case of dissolution dissimilarity, a physiologically based model can be developed utilizing physiochemical, pharmacokinetic, dissolution, and physiological parameters. The model can be validated using literature or in-house plasma concentration-time profiles using virtual bioequivalence testing. Finally, the dissolution data where dissimilarity has been observed, can be inputted into the validated model to demonstrate that dissolution dissimilarity lacks in vivo significance and thus can be justified.
An example where dissolution dissimilarity was superseded with a modeling approach is presented by Bhattiprolu, et al. The formulation was an IR tablet with BCS class III API [38]. The pivotal fasting bioequivalence study was conducted for Market-A and during the leverage of bioequivalence outcome to another Market-B, it was observed that in one of the dissolution conditions (i.e. pH 6.8), dissolution dissimilarity and f2 failure were observed. In order to rule out the impact of dissolution dissimilarity on in vivo performance, a modeling approach was utilized by inputting the dissolution data. The multi-media dissolution data is inputted into the model and the results indicated that the failed f2 doesn’t have an impact on bioequivalence as bioequivalence was established between batches that demonstrated dissolution dissimilarity. It was attributed to the permeability-controlled absorption where dissolution differences may not have a significant impact on in vivo plasma concentration-time profiles. Further, dissolution safe space was established wherein it was demonstrated that dissolution up to 85% in 60 min can result in bioequivalence. This work provided new avenues for extending the dissolution criteria for BCS biowaivers and thus can enable more waiver opportunities. Overall, using the modeling approaches, dissolution dissimilarity can be superseded thereby providing its utility in reduced human clinical studies.
Limitations of the current work
It is also important to note a few limitations of the current work. Although the current work detailed an overview of model independent and model dependent approaches, we did not describe detailed case studies of these approaches considering the scope of the article, i.e. mini-review. The reader may be interested in referring to the quoted references [28,29] in order to further understand the detailed procedure for performing the dissolution profiles comparison with these approaches. Further, in this article, we have detailed about most common approaches used in dissolution profile comparison. However, there are a few additional methods reported in the literature such as the SK method (Saranadasa, Krishnamoorthy) and intersection union test (Berger and Hsu), and the reader is advised to refer to the relevant references [39,40].
Conclusions and future perspectives
Dissolution similarity testing is an essential part and parcel of pharmaceutical development as it is widely used for demonstrating product quality from both manufacturing and clinical perspectives. Traditionally, the f2 similarity factor is widely used for similarity testing, and in the case of highly variable dissolution profiles, alternative statistical methodologies have been suggested. This present article aims to describe both model dependent and independent dissolution profile comparison approaches for calculating the similarity of highly variable dissolution profiles. Various statistical approaches along with their utility in regulatory justifications and context are described with appropriate literature and practical examples. Finally, the utility of physiologically based modeling approaches such as PBPK and PBBM are described as potential, alternative approaches to demonstrate in vivo similarity and to supersede in vitro dissolution dissimilarity. Overall, the approaches described in this article can provide attractive options for biopharmaceutics and pharmaceutical scientists to use approaches to demonstrate dissolution similarity.
Conflicts of interest
All the authors are employees of Dr. Reddy’s Laboratory Ltd. and report no conflicts of interest.
The authors would like to thank Dr. Reddy’s Laboratories Ltd., for providing an opportunity to publish this manuscript.
- Lu JX, Tupper C, Gutierrez AV, Murray J. Biochemistry, Dissolution and Solubility. In: StatPearls [Internet]. Treasure Island (FL): StatPearls Publishing; 2024 Jan-. Available from: https://www.ncbi.nlm.nih.gov/books/NBK431100/
- Shrivas M, Khunt D, Shrivas M, Choudhari M, Rathod R, Misra M. Advances in In Vivo Predictive Dissolution Testing of Solid Oral Formulations: How Closer to In Vivo Performance? J Pharm Innov. 2020;15:296–317. Available from: https://link.springer.com/article/10.1007/s12247-019-09392-6
- Klein S. The Use of Biorelevant Dissolution Media to Forecast the In Vivo Performance of a Drug. AAPS J. 2010;12: 397–406. Available from: https://pubmed.ncbi.nlm.nih.gov/20458565/
- Dickinson PA, Lee WW, Stott PW, Townsend AI, Smart JP, Ghahramani P, et al. Clinical relevance of dissolution testing in quality by design. AAPS J. 2008;10(2):380-90. Available from: https://pubmed.ncbi.nlm.nih.gov/18686045/
- Jambhekar SS, Breen PJ. Drug dissolution: significance of physicochemical properties and physiological conditions. Drug Discov Today. 2013;18(23-24):1173-84. Available from: https://pubmed.ncbi.nlm.nih.gov/24042023/
- ICH M9. Biopharmaceutics Classification System-Based Biowaivers. 2019. Available from: https://database.ich.org/sites/default/files/M9_Guideline_Step4_2019_1116.pdf
- Kollipara S, Ahmed T, Bhattiprolu AK, Chachad S. In vitro and In silico biopharmaceutic regulatory guidelines for generic bioequivalence for oral products: comparison among various regulatory agencies. Biopharm Drug Dispos. 2021;42(7):297–318. Available from: https://pubmed.ncbi.nlm.nih.gov/34019712/
- FDA, US. Extended Release Oral Dosage Forms: Development, Evaluation, and Application of In Vitro/In Vivo Correlations. 1997. Available from: https://www.fda.gov/media/70939/download
- EMA. Guideline on quality of oral modified release products. Available from: https://www.ema.europa.eu/en/documents/scientific-guideline/guideline-quality-oral-modified-release-products_en.pdf
- USFDA. CDER, Guidance for industry, dissolution testing of immediate release solid oral dosage forms. 1997. Available from: https://www.fda.gov/media/70936/download.
- USFDA. CDER, Guidance for industry, dissolution testing and acceptance criteria for immediate‐release solid oral dosage form drug products containing high solubility drug substances. 2018. Available from: https://www.fda.gov/media/92988/download
- EMA. Guideline on the investigation of bioequivalence. 2010. Available from: https://www.ema.europa.eu/en/documents/scientific‐guideline/guidelineinvestigation‐bioequivalence‐rev1_en.pdf.
- EMA. Guideline on quality of oral modified release products. 2014. Available from: https://www.ema.europa.eu/en/documents/scientific‐guideline/guideline‐quality‐oral‐modified‐release‐products_en.pdf
- EMA. Reflection paper on the dissolution specification for generic solid oral immediate release products with systemic action. 2017. Available from: https://www.ema.europa.eu/en/documents/scientific‐guideline/reflectionpaper‐dissolution‐specification‐generic‐solid‐oral‐immediate‐releaseproducts‐systemic_en.pdf.
- China, Determination and comparison of dissolution curves of ordinary oral solid preparations guideline. 2016. Available from: https://www.nmpa.gov.cn/zhuanti/ypqxgg/ggzhcfg/20160318210001633.html.
- ASEAN. ASEAN guideline for the conduct of bioequivalence studies. 2015. Available from: https://asean.org/wp-content/uploads/2021/01/ASEAN-Guideline-for-the-Conduct-of-Bioavailability-and-Bioequivalence-Studies.pdf.
- Health Canada. Post notice of compliance changes quality document. 2009. Available from: https://www.canada.ca/en/health-canada/services/drugs-health-products/drug-products/applications-submissions/guidance-documents/post-notice-compliance-changes/quality-document/guidance.html.
- ANVISA. Realization of Pharmaceutical Equivalence Studies and Comparative Dissolution Profile. RDC 31. 2010. Available from: https://www.pharmacy.umaryland.edu/media/SOP/wwwpharmacyumarylandedu/centers/cersievents/dissolution-similarity/pereira-slides.pdf.
- World Health Organization. Annexure 6. Multisource (generic) pharmaceutical products: guidelines on registration requirements to establish interchangeability. 2017. Available from: https://www.who.int/docs/default-source/medicines/norms-and-standards/guidelines/regulatory-standards/trs1003-annex6-who-multisource-pharmaceutical-products-interchangeability.pdf.
- Yuvaneshwari K, Kollipara S, Ahmed T, Chachad S. Applications of PBPK/PBBM modeling in generic product development: an industry perspective. J Drug Deliv Sci Technol. 2022;69. Available from: https://www.simulations-plus.com/resource/applications-of-pbpk-pbbm-modeling-in-generic-product-development-an-industry-perspective/
- Boddu R, Kollipara S, Bhattiprolu AK, Ahmed T. Novel application of PBBM to justify impact of faster dissolution on safety and pharmacokinetics - a case study and utility in regulatory justifications. Xenobiotica. 2023;53(10-11):587-602. Available from: https://pubmed.ncbi.nlm.nih.gov/38062540/
- Boddu R, Kollipara S, Vijaywargi G, Ahmed T. Power of integrating PBPK with PBBM (PBPK-BM): a single model predicting food effect, gender impact, drug-drug interactions and bioequivalence in fasting & fed conditions. Xenobiotica. 2023;53(4):260-78. Available from: https://pubmed.ncbi.nlm.nih.gov/37471259/
- Jaiswal S, Ahmed T, Kollipara S, Bhargava M, Chachad S. Development, validation and application of physiologically based biopharmaceutics model to justify the change in dissolution specifications for DRL ABC extended release tablets. Drug Dev Ind Pharm. 2021;47(5):778-789. Available from: https://pubmed.ncbi.nlm.nih.gov/34082622/
- EMA. Question and answer on the adequacy of the Mahalanobis distance to assess the comparability of drug dissolution profiles. 2018. Available from: https://www.ema.europa.eu/en/documents/scientific-guideline/question-and-answer-adequacy-mahalanobis-distance-assess-comparability-drug-dissolution-profiles_en.pdf.
- Shah VP, Tsong Y, Sathe P, Liu JP. In vitro dissolution profile comparison--statistics and analysis of the similarity factor, f2. Pharm Res. 1998;15(6):889-96. Available from: https://pubmed.ncbi.nlm.nih.gov/9647355/
- Zhengguo XU. Confidence Intervals of f2 Using Bootstrap Method. 2021. Available from: https://cran.r-project.org/web/packages/bootf2/vignettes/bootf2.html.
- SAS Blogs. The bias-corrected and accelerated (BCa) bootstrap interval. Available from: https://blogs.sas.com/content/iml/2017/07/12/bootstrap-bca-interval.html.
- Boddu R, Kollipara S, Bhattiprolu AK, Parsa K, Chakilam SK, Daka KR, et al. Dissolution Profiles Comparison Using Conventional and Bias Corrected and Accelerated f2 Bootstrap Approaches with Different Software's: Impact of Variability, Sample Size and Number of Bootstraps. AAPS PharmSciTech. 2023;25(1):5. Available from: https://pubmed.ncbi.nlm.nih.gov/38117372/
- Kollipara S, Boddu R, Ahmed T, Chachad S. Simplified Model-Dependent and Model-Independent Approaches for Dissolution Profile Comparison for Oral Products: Regulatory Perspective for Generic Product Development. AAPS PharmSciTech. 2022;23(1):53. Available from: https://pubmed.ncbi.nlm.nih.gov/35028797/
- Hoffelder T. Comparison of dissolution profiles: a statistician’s perspective. Ther Innov Regul Sci. 2018;52(4):423–9. Available from: https://link.springer.com/article/10.1177/2168479017749230
- FDA, US. Physiologically Based Pharmacokinetic Analyses — Format and Content. 2018. Available from: https://www.fda.gov/media/101469/download
- EMA Guideline on the reporting of physiologically based pharmacokinetic (PBPK) modelling and simulation. 2018. Available from: https://www.ema.europa.eu/en/documents/scientific-guideline/guideline-reporting-physiologically-based-pharmacokinetic-pbpk-modelling-and-simulation_en.pdf.
- Ahmed T, Kollipara S, Boddu R, Bhattiprolu AK. Biopharmaceutics Risk Assessment—Connecting Critical Bioavailability Attributes with In Vitro, In Vivo Properties and Physiologically Based Biopharmaceutics Modeling to Enable Generic Regulatory Submissions. The AAPS J. 2023;25(5):77. Available from: https://pubmed.ncbi.nlm.nih.gov/37498474/
- Kollipara S, Martins FS, Sanghavi M, Santos GML, Saini A, Ahmed T. Role of Physiologically Based Biopharmaceutics Modeling (PBBM) in Fed Bioequivalence Study Waivers: Regulatory Outlook, Case Studies and Future Perspectives. J Pharm Sci. 2024;113(2):345-358. Available from: https://pubmed.ncbi.nlm.nih.gov/38043684/
- Kollipara S, Bhattiprolu AK, Boddu R, Ahmed T, Chachad S. Best Practices for Integration of Dissolution Data into Physiologically Based Biopharmaceutics Models (PBBM): A Biopharmaceutics Modeling Scientist Perspective. AAPS PharmSciTech. 2023 Feb 9;24(2):59. Available from: https://pubmed.ncbi.nlm.nih.gov/36759492/
- Boddu R, Kollipara S, Rachapally A, Ahmed T. Experience on Utilization of Novel Modeling & Simulation Approaches in Generic Product Development. J Biomed Res Environ Sci. 2024 Jun 14;5(6):588-596. doi: 10.37871/jbres1931. Article ID: JBRES1931. Available from: https://www.jelsciences.com/articles/jbres1931.pdf
- Mondal S, Kollipara S, Chougule M, Bhatia A, Ahmed T. Biopredictive Dissolutions for Conventional Oral IR, MR and Non-Oral Formulations – Current Status and Future Opportunities. J Drug Deliv Sci Technol. 2024;97:105807. Available from: https://www.sciencedirect.com/science/article/abs/pii/S1773224724004763
- Bhattiprolu AK, Kollipara S, Ahmed T, Boddu R, Chachad S. Utility of Physiologically Based Biopharmaceutics Modeling (PBBM) in Regulatory Perspective: Application to Supersede f2, Enabling Biowaivers & Creation of Dissolution Safe Space. J Pharm Sci. 2022;111(12):3397-410. Available from: https://pubmed.ncbi.nlm.nih.gov/36096285/
- Saranadasa H, Krishnamoorthy K. A multivariate test for similarity of two dissolution profiles. J Biopharm Stat. 2005;15(2):265–78. Available from: https://pubmed.ncbi.nlm.nih.gov/15796294/
- Berger RL, Hsu JC. Bioequivalence trials, intersection union tests and equivalence confidence sets. Stat Sci. 1996;11(4):283–302. Available from: https://asu.elsevierpure.com/en/publications/bioequivalence-trials-intersectiounion-tests-and-equivalence-conf
Article Alerts
Subscribe to our articles alerts and stay tuned.
 This work is licensed under a Creative Commons Attribution 4.0 International License.

 Save to Mendeley
