International Journal of Pharmaceutical Sciences and Developmental Research
Validated method for estimation of ethamsylate by UV-spectroscopy
Sanjay Kumar Karan* and Subhasmita Subhadarshinee
Cite this as
Karan SK, Subhadarshinee S (2024) Validated method for estimation of ethamsylate by UV-spectroscopy. Int J Pharm Sci Dev Res 10(1): 001-005. DOI: 10.17352/ijpsdr.000050Copyright License
© 2024 Karan SK, et al. This is an open-access article distributed under the terms of the Creative Commons Attribution License, which permits unrestricted use, distribution, and reproduction in any medium, provided the original author and source are credited.For the estimation of ethamsylate in pharmaceutical tablet dosage forms an accurate, simple, efficient spectrophotometric method was developed and validated. It showed absorption maxima at 300 nm with distilled water. According to ICH guidelines, the method was validated concerning specificity, linearity, accuracy, and precision. Ethamsylate’s linearity and range were found to be 5 to 50 μg/ml, with a correlation coefficient of 0.999. The analysis's findings were verified statistically and estimation of ethamsylate was done in marketed formulation.
Introduction
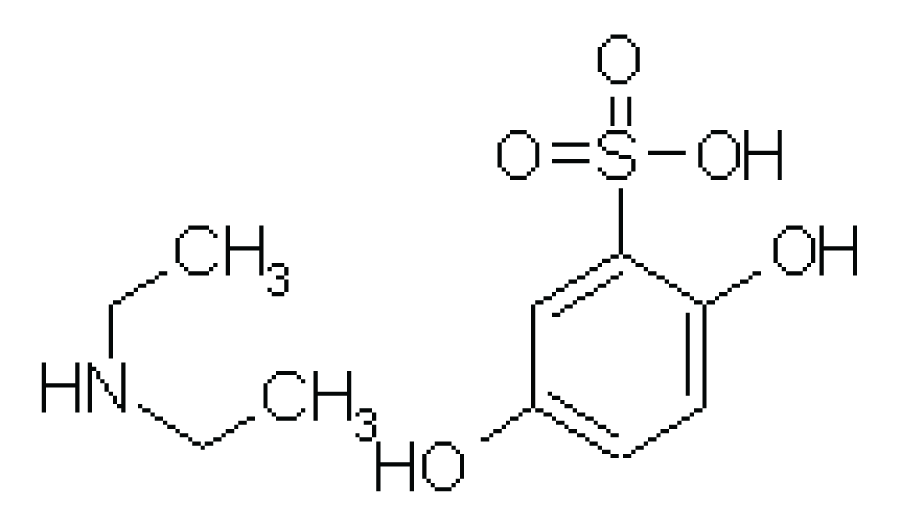
Ethamsylate chemically designated as 2, 5-Dihydroxybenzenesulfonic acid; N-ethylamine is a category of antihemorrhagics / antihemophilic with molecular formula C10H17NO5S (Figure 1). The molecular mass of Ethamsylate is 263.34 gm/mol [1]. It is a white crystalline powder that is easily soluble in water and ethanol; slightly soluble in acetone and insoluble in chloroform and ether [2]. Ethamsylate stops hemorrhage from small blood vessels by stabilizing the capillary wall and correcting abnormal platelet adhesion. It is also used as prophylaxis and treatment of periventricular hemorrhage in low birth weight infants. It is absorbed from the GI tract (oral) [3,4].
According to the literature review, there are only a few analytical methods available for the separation and estimation of Ethamsylate, such as UV-Spectrometry, RP-HPLC, HPTLC, GC, and LC-MS [5-8]. There is a need to develop and validate a new simple, rapid, reliable, and precise UV spectrophotometric method for the analysis of Ethamsylate [9-11]. Suitable statistical tests were performed on validation data. The goal of this work is to develop a new method for the UV-estimation of Ethamsylate and this is a simple, cost-effective, reproducible, and reliable spectroscopy method.
Materials and methods
Materials
Instruments used- Agilent Tech. provided the Single beam UV-Spectroscopy model no. Cary 60 UV-Vis; Shimadzu Instrument Pvt. Ltd. Provided Digital weighing balance model no. TX323L; Perkin Elmer provided FT-IR model no. Spectrum 2. Reagents and solutions- Methanol grade A from S.D.Fine Chemical Ltd.; Ethamsylate from Windlas Biotech Ltd (Tables a-c).
Standard stock solution preparation
Weighed accurately 50 mg of Ethamsylate in a 50ml volumetric flask then added 20 ml of distilled water and made the volume up to the mark. 1 ml of this solution was transferred to a 10 ml volumetric flask and diluted up to 10 ml with distilled water. 1 ml of this dilute solution was further diluted with 10 ml of distilled water. This solution contained 10 µg of drug per ml of the solution.
Wavelength selection
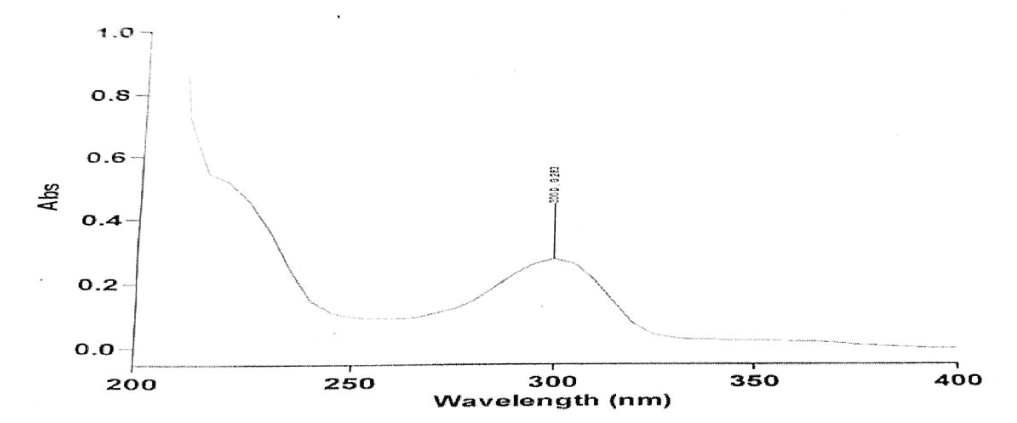
1ml of standard stock solution was pipette out and transferred to a 10 ml of the volumetric flask, then the volume was made up to the mark with distilled water. This solution contained 1µg/ml of the drug. The absorbance of this solution was scanned in the UV range of 200 to 400 nm against distilled water as blank [12,13]. Ethamsylate was detected at 300 nm as shown in Figure 2.
Melting point determination
The melting point was determined by the melting point apparatus. The compound was placed in one-end-sealed capillary. The capillary and thermometer were placed in the caves made for the capillary and thermometer respectively [14]. The temperature at which the compound melted was measured by the thermometer and the melting range of Ethamsylate was found to be 127 0C – 131 0C.
Method validation
The devised analytical technique was validated following ICH for the following criteria: system suitability; specificity; accuracy; precision; linearity and range; Limit of Detection (LOD) and Limit of Quantification (LOQ) [15-17].
System suitability
1gm of Ethamsyltae was dissolved in 50 ml of water in a stoppered vessel at room temperature and the vessel was shaken for a few minutes and examined visually for a few more minutes and examined visually for the presence of any residue. No residue was present in the solution interfering with the free solubility of Ethamsylate in water.
Specificity
The system's appropriateness for specificity was tested to see if any contaminants interfered with the analytical peak's retention time. Blank injections were used to conduct the trial [18].
About 1ml of the stock solution was taken in six 10 ml volumetric flasks and about 1ml of a 10 µg/ml solution of each excipient (magnesium stearate, starch, talc, lactose) was added to them and the volume was made up to mark with distilled water. The concentrations of the solutions were determined and % interference was calculated. The results are shown in Table 1.
Accuracy
For Ethamsylate, the accuracy study was carried out at 80%, 100%, and 120%. Each level's area was used to calculate the recovery percentage. 10 µg/ml Ethamsylate standard solution was spiked with 8, 10, and 12 µg/ml sample solution of Ethamsylate tablets. The absorbance was measured and % recovery results are shown in Tables 2,3.
Acceptance Criteria: Each level of concentration should have a recovery percentage of 98% - 102%.
Precision
0.5 ml of the standard stock solution was taken in a 10ml volumetric flask and the volume was made up to the mark with distilled water. This solution contains 5 µg/ml of the drug. The absorbance of this solution was measured six times and recorded. The results are shown in Table 4.
Acceptance Criteria: The RSD percentage should not be greater than 2% for the area of six standard injection results.
Intra-day precision
2 ml, 3 ml, and 4 ml of the standard stock solution was taken in a 10 ml volumetric flask and the volume was made up to the mark with distilled water to obtain 20, 30, and 40 µg/ml concentrations. The absorbance of these solutions individually was measured thrice within a day and recorded. The results are shown in Table 5.
Inter-day precision
2 ml, 3 ml, and 4 ml of the standard stock solution was taken in a 10 ml volumetric flask and the volume was made up to the mark with distilled water to obtain 20, 30, and 40 µg/ml concentrations. The absorbance of these solutions individually was measured thrice in three days and recorded. The results are shown in Table 6.
Linearity and range
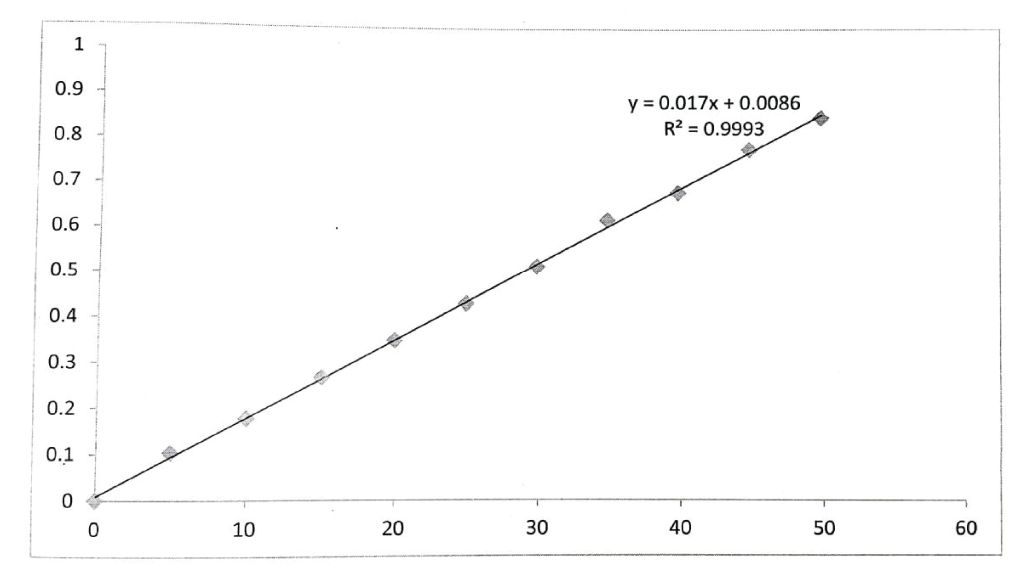
A linear relationship was observed between absorbance and concentration in the working range of 5 to 50 µg/ml of drug in the solution at 300 nm [19]. Take distilled water as blank and also plot a graph between the absorbance obtained and the concentration of the solution. The correlation coefficient of 0.999 was calculated using the area of each level which is shown in Table 7, Figure 3.
Acceptance Criteria: The correlation coefficient for the results of the area of five standard injections must be greater than or equal to (> =) 0.999.
Limit of detection and limit of quantification
The smallest concentration of analyte that can be accurately detected by an analytical process is referred to as the Limit of Detection (LOD) and Limit of Quantification (LOQ) [20].
The LOQ might be substantially higher in concentration or it might be equal to the LOD.
Equations were used to calculate the LOD and LOQ.
LOD = 3.3 × σ / S and
LOQ = 10 × σ / S
Where,
σ is the standard deviation of the Calibration curve.
S is the average of the slope of the corresponding Calibration curve.
Estimation of ethamsyltae
The powder of twenty tablets of Ethamcip (250 mg) from Cipla Ltd. was taken and accurately weighed. Accurately about 92 mg powder (equivalent to 50 mg of Ethamsylate) was dissolved in about 30ml water and ultra sonicate for up to 15 minutes and filtered through Whatman Filter paper 40 into 50 ml volumetric flak. The residue was washed with more water into the flask. The volume was made up to the mark with water. 2.5 ml of the resultant solution was transferred to 25 ml volumetric flask and the volume was made up to the mark with water to obtain a solution of 10 µg/ml of the drug [21]. The absorbance of this solution was measured in quadruplets and recorded. The concentration was then determined from the calibration curve. The results are shown in Tables 8 and 9.
Result and discussion
Specificity
The specificity test for Ethamsylate was conducted. It was concluded that the developed method is specific and there are no interferences of excipients since the % interference was negligible (0.2656). The results are shown in Table 1.
Readings of accuracy (Tables 2,3)
Precision
Keeping the concentration of the drug the same, the procedure was repeated 6 times. The calculated RSD for the repeatability study is 1.873, which is acceptable; this shows good repeatability of the method.
The absorbance readings were taken in triplicate for each concentration at 0 hr, 3 hr, and 6 hr within a day. The calculated mean RSD was 0.847.
The absorbance readings were taken in triplicate for each concentration at 0 hr, 24 hr, and 48 hr intervals. The calculated mean RSD was 0.7877.
Linearity and range
With a correlation value (R2) of 0.999, the calibration curve for anastrozole (API) demonstrated good linearity in the range of 5-50 µg/ml. For anastrozole, the standard calibration curve has the regression equation y = 0.017x + 0.0086.
LOD (Limit of Detection) and LOQ (Limit of Quantification)
Ethamsylate's minimum concentration levels at which it can be reliably detected (LOD) and quantified (LOQ) were found to be 0.16 µg/ml and 1.64 µg/ml, respectively, indicating that the method's sensitivity is high.
Estimation of ethamsyltae (Tables 8,9)
Conclusion
The findings of this investigation demonstrate that the proposed method is simple, rapid, accurate, precise, economical, and reproducible for UV spectrophotometric estimation of Etamsylate from pharmaceutical formulation. The absorbance of this solution was scanned in the UV range of 200 to 400 nm and it was detected at 300 nm. The results of statistical analysis for marketed formulations were studied and are shown in Table 9. Investigation of some new economical analytical methods is needed for the quantitative estimation of Ethamsylate in bulk and pharmaceutical dosage forms with high sensitivity, accuracy, and precision. The spectroscopic method is used because of its simplicity; high specificity and low cost can also effectively analyze the compound.
- British Pharmacopoeia, Her Majesty’s Stationery Office. London, Ph Eur Monograph. 1204; 2005; 1:762.
- Mendham J. Vogel’s. Textbook of Quantitative Chemical Analysis. 6th ed. Pearson Education (Singapore) Pvt. Ltd., Indian branch, Delhi. 2003; 3-8:630.
- O'Neil MJ. Royal Society of Chemistry. Cambridge, UK. The Merck Index: An Encyclopedia of Chemicals, Drugs, and Biologicals, 13th ed New Jersey, Merck and Co. 3757:664.
- Sweetman SC. Martindale C. The Complete Drug Reference. 33rd ed London (UK), Pharmaceutical Press. 2002:732.
- Hema SRG. A review on new analytical method development and validation by RP-HPLC. Int Res J Pharm Biosci, 2017; 4:41-50.
- Nagaraju P, Krishna chaithanya K, Srinivas VDN. Reverse Phase HPLC Method for the Determination of Ethamsylate in Bulk and Tablet Dosage Forms. Asian Journal Research Chem. 2008; 1(2):0974-4169.
- Vamshikrishan N, Shetty ASK. Development and validation of RP-HPLC Method for the estimation of Ethamsylate in bulk drug and its Pharmaceutical Formulations. Inetrnational Journal ChemTech Res. 2011; 3(2):928-32.
- Neeraj K, Himani A, Abhijit K, Dhaneshwar SR, Bharat P. Stress degradation studies on etamsylate using stability-indicating chromatographic methods. Analytica Chimica Acta. 2005; 536(1-2):49-70.
- Yogini SJ, Gokul ST, Sanjay JS. Quantitative Analysis of Ethamsylate and Mefenamic Acid in Tablets by Use of Planar Chromatography. Journal of Planar Chromatography. 2005; 18:460-4.
- Roshan I, Kaushik KV, Diptish KN. Spectrophotometric methods for Simultaneous estimation of Ethamsylate and Tranexamic acid from combined tablet dosage form. International Journal ChemTech Res. 2010; 2(1):74-8.
- Pavia D, Lampman G, Krix G. Introduction to Spectroscopy. Bloomington, IN: Indiana University. 2001.
- Arshad Md, Karadi AB, Raju SA, Venugopal D. Spectrophotometric estimation of Ethamsylate in bulk drug and its Pharmaceutical Formulations, Pharma Science Monitor. An International Journal of Pharmaceutical Sciences. 2011; 2(4):0976-7908.
- Rao RN, Nagaraju P, Shrinivasulu C, Kumar PJ. Comparative study of UV Spectrophotometric Methods for the Determination of Ethamsylate in Bulk and Pharmaceutical Formulations. Asian Journal of Chemistry. 2004; 16(3): 1956-1958.
- Indian Pharmacopoeia, Ministry of Health and Family Welfare India. Vol II (A), 1996; 144-147.
- International Conference on Harmonization, Q2B: Guideline on the Validation of Analytical Procedures: Methodology and Availability. Federal Register. 1997; 62(96):27463–27467.
- Patil R, Deshmukh T, Patil V, Khandelwal K. Review on analytical method development and validation. Res Rev J Pharm Anal. 2014; 3:1-10.
- Vamshikrishna N, Shetty ASK. Development and Validation of RP-HPLC Method for the estimation of Ethamsylate in Bulk drug and Pharmaceutical formulations. Int J ChemTech Res. 2011; 3(2):928-32.
- Pathuri R, Muthukumaran M, Krishnamoorthy B, Nishat A. A review of analytical method development and validation of the pharmaceutical technology. Curr Pharm Res. 2013; 3:855-70.
- Chitra K, Sujatha K, Ahmed IR, Shalini K, Priya BL, Varghese SS. Spectrophotometric Estimation of Ethamsylate in Tablets and Injection. Indian J Pharm Sci. 2005; 67:98–100.
- Shivani Sharma, SwapnilGoyal, KalindiChauhan. A review of analytical method development and validation. International Journal of Applied Pharmaceutics. 2018; 10(6):8-15.
- Arshad MD, Karadi B. A., et al, Development and Validation of Visible Spectrophotometric methods for the Estimation of Ethamsylate in Pharmaceutical Dosage Forms, Scholars Research Library Der Pharma Chemica. 2011; 3(2): 347- 351.
Article Alerts
Subscribe to our articles alerts and stay tuned.
 This work is licensed under a Creative Commons Attribution 4.0 International License.


 Save to Mendeley
